Nonprofit Organizations
in New Hampshire by County

New Hampshire
Nonprofit Organization Totals
- Get Unlimited Access to 990 Returns
- Get Contact Info, Financial Details, and more
- Save to Excel, CSV, Access, or TXT
Download the New Hampshire List
Download the entire list of New Hampshire Nonprofit Organizations to your computer/laptop/phone
- Number of Organizations 15,261
- Reported Asset Amount Total $51,650,037,364
- Reported Income Amount Total $25,911,057,286
- Number of Counties in this State 10
New Hampshire Counties Ranked by Nonprofit Assets
Download the New Hampshire List
Get Unlimited Access to all Nonprofit Data for Organizations Located in this State
Sorting List ...

| Rank # | County | Asset Amount | Percentage of Total State Assets | Income Amount | Organization Count |
|---|---|---|---|---|---|
| 1 | Grafton County NH | $18,362,879,681 | 35.55% | $10,684,746,078 | 1,746 |
| 2 | Rockingham County NH | $10,048,748,880 | 19.46% | $2,070,691,291 | 2,878 |
| 3 | Hillsborough County NH | $10,019,964,096 | 19.40% | $5,041,640,578 | 3,733 |
| 4 | Merrimack County NH | $8,721,675,725 | 16.89% | $5,362,335,074 | 2,276 |
| 5 | Strafford County NH | $1,256,937,189 | 2.43% | $584,611,208 | 1,141 |
| 6 | Cheshire County NH | $889,162,183 | 1.72% | $739,819,699 | 976 |
| 7 | Carroll County NH | $854,318,950 | 1.65% | $536,491,196 | 779 |
| 8 | Belknap County NH | $711,180,364 | 1.38% | $312,840,640 | 788 |
| 9 | Sullivan County NH | $449,081,124 | 0.87% | $219,174,353 | 510 |
| 10 | Coos County NH | $336,089,172 | 0.65% | $358,707,169 | 434 |
Download the New Hampshire List
Save the entire list of nonprofits in this state to a spreadsheet or other file type
Sample 990 Files (click ot view)
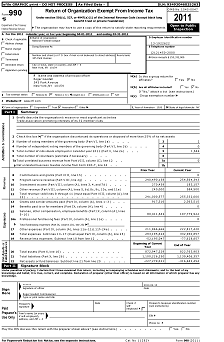
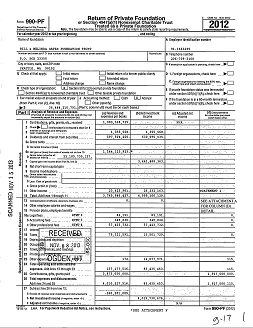
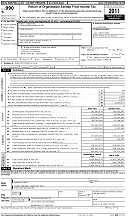
- Phone numbers and other contact information for an organization are typically included in 990 files - click the sample pdf files above to view.